
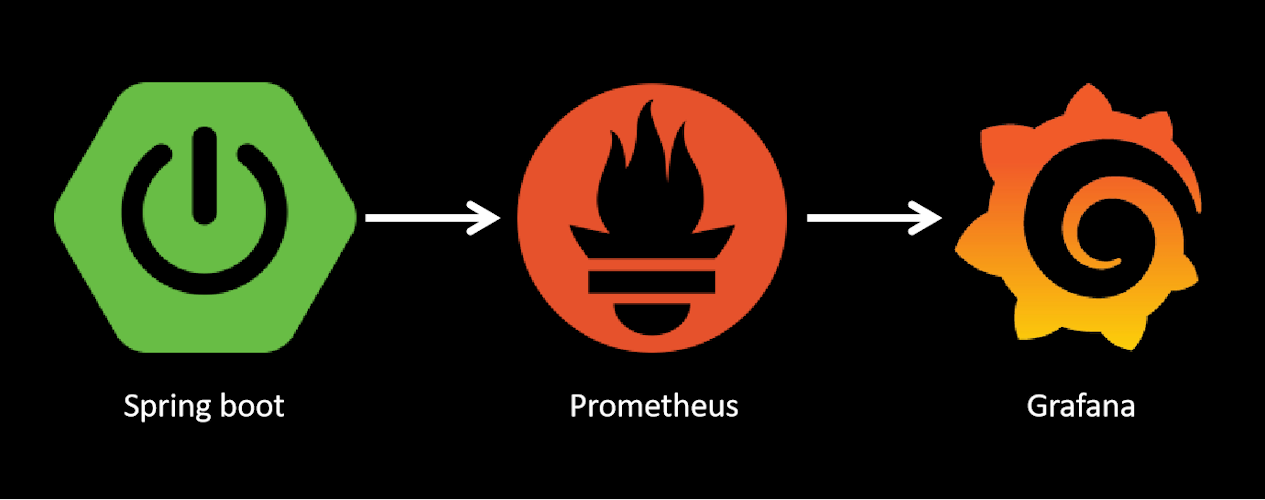
In this article, we will be looking into how we can monitor our Spring Boot application using Grafana. We would be looking into the whole setup and create a simple dashboard to view some metrics.
1 Application
Spring Boot is a very popular microservice framework that significantly simplifies web application development by providing Java developers with a platform to get started with an auto-configurable, production-grade Spring application.
1.1 Actuator
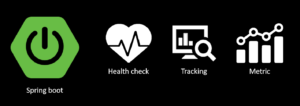
Actuator endpoints let you monitor and interact with your Spring Boot application.
Read this article for more details : spring boot actuator
1.2 Setup
- Prometheus dependency
To expose prometeus enndpoint we nedd to add this dependency
        <dependency>
            <groupId>org.springframework.boot</groupId>
            <artifactId>spring-boot-starter-web</artifactId>
        </dependency>

        <dependency>
            <groupId>org.springframework.boot</groupId>
            <artifactId>spring-boot-starter-actuator</artifactId>
        </dependency>

        <dependency>
            <groupId>io.micrometer</groupId>
            <artifactId>micrometer-registry-prometheus</artifactId>
            <scope>runtime</scope>
</dependency>- Spring Boot properties
Next, we need to expose an actuator endpoint through which Prometheus will collect metrics data in the format that Prometheus understands. For this, we need to add the following properties.
# -- actuator global configuration -- #
management:
  endpoints:
    web:
      exposure:
        include: "health,info,prometheus"
  endpoint:
    health:
      show-details: always
    metrics:
      enabled: true
    prometheus:
      enabled: true

management.metrics:
  tags:
    application: ${spring.application.name}
    env: ${spring.profiles.active}
  distribution:
    percentiles-histogram:
      http:
        server:
          requests: 'true'
You can reach the info actuator on your local machine : http://localhost:8080/actuator/prometheus once you start your Spring Boot application.
The prometheus endpoint shows various metrics, such as JVM threads state, information about HTTP server requests, etc.
- Metics data
After opening the above endpoint, you will find some metrics data in the following format
jvm_memory_used_bytes{application="spring-prometheus-client",area="nonheap",env="local",id="Metaspace",} 4.417008E7
jvm_memory_used_bytes{application="spring-prometheus-client",area="heap",env="local",id="G1 Survivor Space",} 8388608.0
jvm_memory_used_bytes{application="spring-prometheus-client",area="nonheap",env="local",id="CodeHeap 'non-nmethods'",} 1294336.0
jvm_memory_used_bytes{application="spring-prometheus-client",area="heap",env="local",id="G1 Old Gen",} 9224992.0
jvm_memory_used_bytes{application="spring-prometheus-client",area="nonheap",env="local",id="CodeHeap 'non-profiled nmethods'",} 1.0788608E7
jvm_memory_used_bytes{application="spring-prometheus-client",area="nonheap",env="local",id="Compressed Class Space",} 5484736.0
jvm_memory_used_bytes{application="spring-prometheus-client",area="heap",env="local",id="G1 Eden Space",} 2.5165824E7
The first part (jvm_memory_used_bytes) is called the label, while the fields inside the curly braces are called attributes. Each of these labels represents a particular metric and the attribute provides you with a way to query so that you can get the values.
2 Prometheus
Prometheus gathers metrics at intervals and needs to know how often to scrape them.
We will be using a Prometheus docker image and provide it with some configuration
2.1 Configuration file
# my global config
global:
  scrape_interval:     120s  # By default, scrape targets every 15 seconds.
  evaluation_interval: 120s  # By default, scrape targets every 15 seconds.

# A scrape configuration containing exactly one endpoint to scrape:
# Here it's Prometheus itself.
scrape_configs:
  - job_name: 'Spring Boot Application input'
    metrics_path: '/actuator/prometheus'
    scrape_interval: 2s
    static_configs:
      - targets: ['host.docker.internal:8080']
Important notes :
scrape_interval: Scrape the application and collect information every 2 secondstargets: The target is the host and port of our application.metrics_path: The path we want to scrape.
2.2 Start service
Create a docker-compose file that will bring the Prometheus docker image up and running.
services:
  prometheus:
    image: prom/prometheus
    container_name: prometheus
    command:
      - '--config.file=/etc/prometheus/prometheus.yml'
    ports:
      - 9090:9090
    volumes:
      - ./prometheus/:/etc/prometheus/
the config file is mounted at the location /etc/prometheus and we use the location of the config file as an argument to the command.
2.3 Test
1- Start spring application
2- Start the docker image with docker compose up -d
3- Open the URL http://localhost:9090 on browser.
4- Search for the label http_server_requests_seconds_count
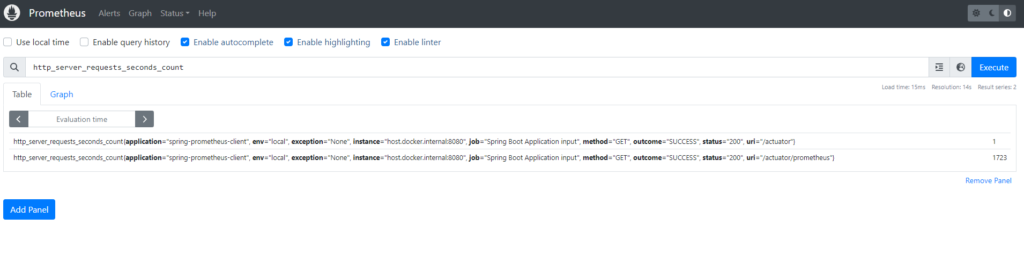
In case you don’t find the label, You can check if the job is running by navigating to « Status > Targets ». You should see the state as “UP ».
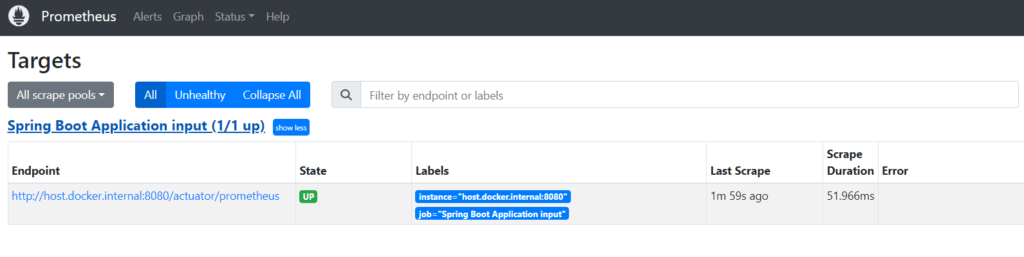
Now, the data is getting ingested into Prometheus every 2 seconds.
Although Prometheus has a decent UI, Grafana’s Dashboard is more powerful.
3- Grafana
Before starting Grafana we need to do some configuration to prepare the data source and dashboard. with that, we no longer need to create them manually.
3.1 Datasource
First we need to add and configure the Prometheus data source.
apiVersion: 1

# list of datasources that should be deleted from the database
deleteDatasources:
  - name: Prometheus
    orgId: 1

datasources:
- uid: prometheus
  orgId: 1
  name: Prometheus
  type: prometheus
  url: http://prometheus:9090
  isDefault: true
  access: proxy
  readOnly: false
  editable: true
3.2 Dashboard
To prepare the Dashboard we need two things :
- Dashboard config file : dashboards.yaml
- Dashboard source file : data-observability.json
3.3 Start service
Create a docker-compose file that will bring the Grafana docker image up and running.
  grafana:
    image: grafana/grafana
    container_name: grafana
    depends_on:
      - prometheus
    ports:
      - 3000:3000
    user: root
    environment:
      - GF_SECURITY_ADMIN_USER=admin
      - GF_SECURITY_ADMIN_PASSWORD=admin
    volumes:
      - ./grafana/datasources:/etc/grafana/provisioning/datasources # data sources
      - ./grafana/dashboards.yaml:/etc/grafana/provisioning/dashboards/dashboards.yaml # dashboard setting
      - ./grafana/dashboards:/etc/grafana/dashboards # dashboard json files directory
3.4 Test
2- Start the docker image with docker compose up -d
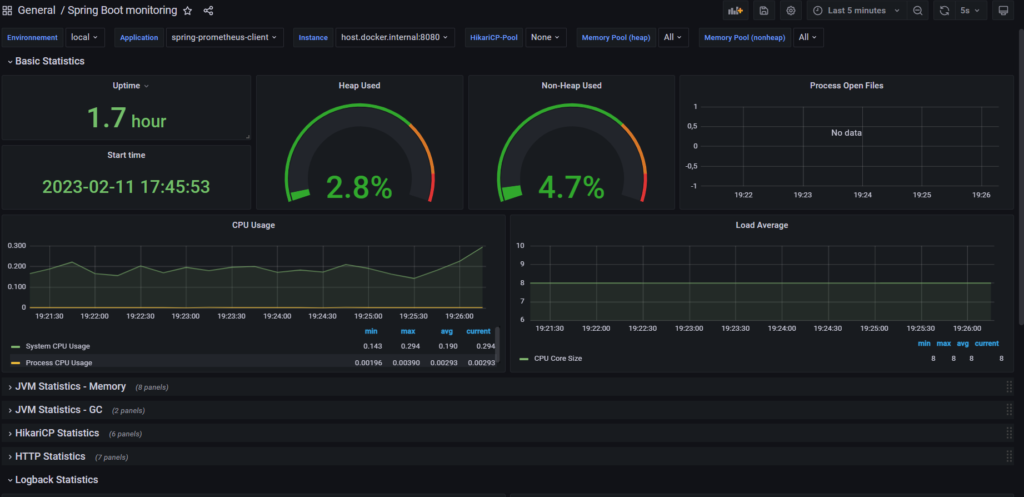
3- Open the URL http://localhost:3000 on browser.
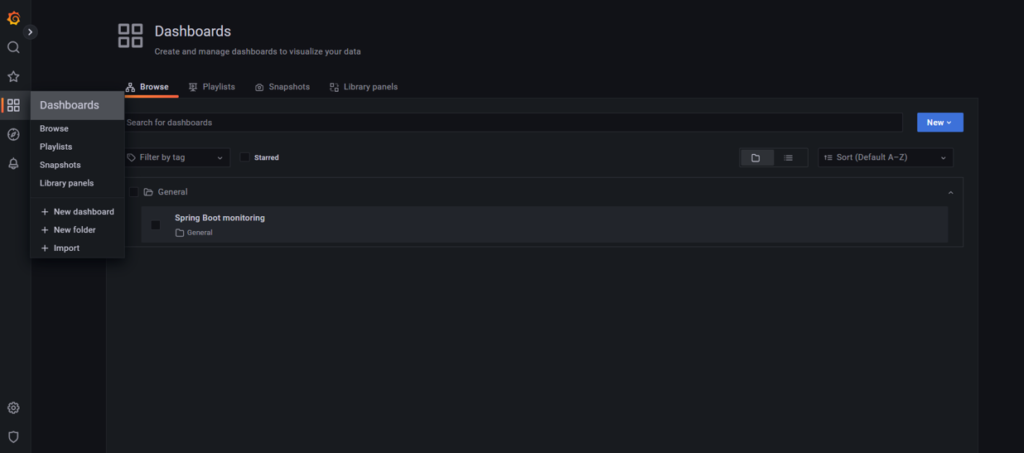
We can see our Dashboard that we have already configured
4. Source code
The complete source code of this article can be found over on GitHub.
Reference
https://refactorfirst.com/spring-boot-prometheus-grafana
https://dev.to/luafanti/spring-boot-monitoring-with-prometheus-operator-40g1