Monitoring with Prometheus and Grafana
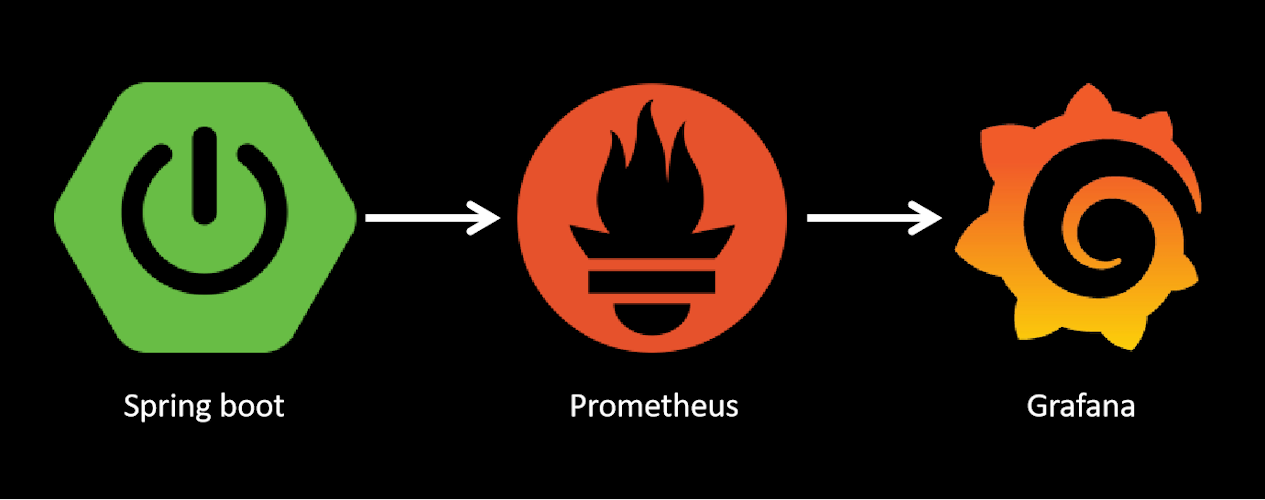
In this article, we will be looking into how we can monitor our Spring Boot application using Grafana. We would be looking into the whole setup and create a simple dashboard to view some metrics.
(suite…)

In this article, we will be looking into how we can monitor our Spring Boot application using Grafana. We would be looking into the whole setup and create a simple dashboard to view some metrics.
(suite…)
In this article, we introduce the Spring Boot Actuator, take a look at how to customize the Spring Boot Actuators’ /info endpoint and how to track and monitor this startup information.
(suite…)